")
What Is Year-Over-Year (YOY)?
Ever wondered how businesses or investors figure out if they’re actually getting ahead? Enter Year-Over-Year (YOY)—a simple yet powerful way to measure growth by comparing a stat, like revenue or profits, from one period to the same period a year earlier. It’s like a financial time machine that shows whether things are trending up, flatlining, or tanking.
What’s YOY All About?
YOY—sometimes called year-on-year—is a go-to tool in finance for sizing up performance over a 12-month gap. Think of it as a report card for companies or even entire economies. You might spot a headline saying a retailer’s third-quarter sales jumped YOY for three years straight—that’s a quick clue they’re on a roll.
Quick Hits
- Compares a stat (like sales) from one period to the same period last year.
- Loved by investors and analysts for gauging financial health.
- Helps spot growth—or decline—without seasonal noise muddying the picture.
Why YOY Matters
Unlike month-to-month check-ins, which can get skewed by holiday spikes or summer slumps, YOY zooms out for a clearer view. It’s perfect for quarterly or annual deep dives, letting you see if a company’s cash flow is really improving or just riding a seasonal wave.
The Perks
- Apples-to-Apples: Comparing Q1 this year to Q1 last year cuts through seasonal quirks—like retailers raking it in during December but not July.
- Portfolio Pulse: Investors use YOY to track how their holdings stack up over time, not just in fleeting snapshots.
- Trend Spotting: It’s a fast way to see if revenue’s climbing or profits are slipping, no guesswork needed.
How YOY Gets Used
Seasonality messes with most businesses—think Black Friday booms or slow January blues. YOY sidesteps that by matching like periods. For example, pitting this year’s Q4 against last year’s Q4 shows true growth, not just a holiday bump. Compare that to Q3, and you might think a retailer’s unstoppable—until you realize it’s just Christmas magic at work.
It’s different from “sequential” tracking (like Q3 to Q4), which shows short-term shifts. YOY’s about the long game—think airline seats filled in January 2025 versus January 2024, not December’s leftovers.
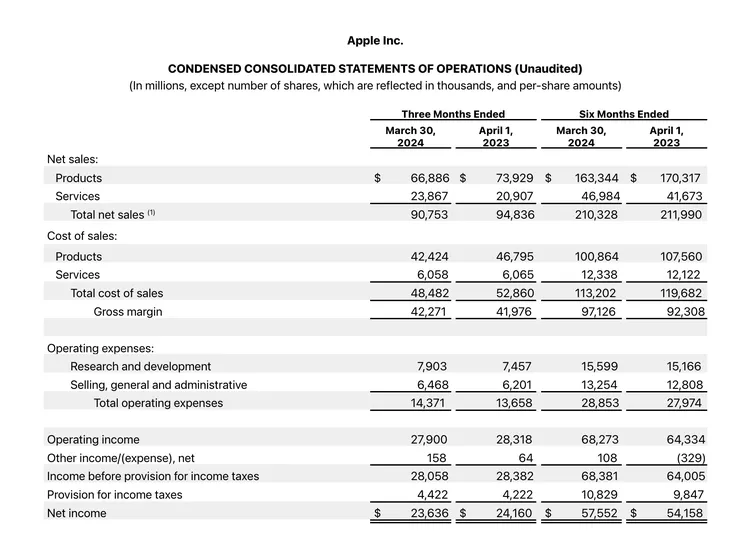
Real-World Example: Apple’s Q2
Take Apple’s Q2 2024 numbers. Net sales hit $90.8 billion, down from $94.8 billion in Q2 2023—a 4.3% YOY drop. Net income? $23.6 billion this year versus $24.2 billion last year, a 2.2% dip. That’s YOY in action, showing Apple’s taken a slight hit compared to 12 months prior.
What’s YOY Good For?
- Business Checkups: Companies use it to measure growth in sales, profits, or whatever else they track—third-quarter earnings this year versus last, for instance.
- Big Picture Stats: Economists apply it to GDP, money supply, or other macro trends to see how the economy’s shifting year to year.
- Investor Insights: It’s a lifeline for anyone picking stocks or tweaking portfolios, revealing patterns over time.
Crunching the Numbers
Calculating YOY is a breeze: take this year’s figure, divide it by last year’s, subtract 1, then multiply by 100 for a percentage. So, if sales were $100 million last year and $104 million this year:
(104 ÷ 100) – 1 = 0.04 × 100 = 4% YOY growth. Easy, right?
YOY vs. YTD: What’s the Difference?
- YOY: Looks back 12 months (e.g., March 2025 vs. March 2024).
- Year-to-Date (YTD): Tracks from January 1 to now (e.g., Jan 1, 2025, to March 22, 2025).
YOY’s a head-to-head showdown; YTD’s a running tally.
Shorter Time Frames?
Want a tighter lens? You can tweak it for month-over-month or quarter-over-quarter (Q/Q) the same way—just pick your periods.
Why It’s a Game-Changer
YOY strips away the noise, giving companies, investors, and analysts a clean look at progress. For businesses, it’s a reality check—time to pivot or double down? For investors, it’s a signal to hold or sell. And for analysts, it’s fuel for forecasts. Whether it’s a tech giant like Apple or a small retailer, YOY paints the picture of where things stand—and where they might be headed.
FAQs
What Does Year-Over-Year (YOY) Mean?
YOY is a way to measure growth by comparing a financial stat—like revenue or profits—from one period to the same period a year earlier. It’s like checking if your favorite team scored more points this season than last, giving you a clear picture of progress.
Why Is YOY Better Than Month-to-Month Comparisons?
Month-to-month numbers can trick you with seasonal ups and downs—think holiday sales spikes. YOY skips that noise by matching the same time frame across years, so you see real growth, not just a temporary blip.
How Do You Calculate YOY Growth?
It’s simple: take this year’s number, divide it by last year’s, subtract 1, then multiply by 100 for a percentage. For example, if sales went from $100 million to $104 million, it’s (104 ÷ 100) – 1 = 0.04 × 100 = 4% YOY growth.
What’s the Difference Between YOY and YTD?
YOY compares a specific period to the same one last year—like Q3 2025 vs. Q3 2024. Year-to-Date (YTD) tracks from January 1 to now, showing a running total. YOY’s a head-to-head; YTD’s a year-long tally.